The following case study was originally published by The Beryl Institute and features Northwell Health’s journey in systematically enhancing the patient experience by empowering care team members with a data-driven rounding process to proactively identify, address, and ultimately, reduce avoidable incidents in service delivery.
What was the opportunity, issue or challenge you were trying to address and in what setting?
Identifying patient satisfaction levers is a key component of improving patient perceptions of care and directly impacts outcome measures. Patient satisfaction is an outcome that can be defined and derived by the sum of all patients’ experiences during hospitalization. Although post-discharge surveys are focused on satisfaction, the process cannot address a negative experience in real time. Northwell Health recognized an opportunity to proactively identify common failings that lead to poor patient experience and ultimately drive the desired outcomes. In this process, Northwell Health learned that recurring pain points identified in patient feedback across emergency departments (ED) and inpatient units (such as lack of privacy, comfort, and communication) were consistent with themes observed by a variety of clinician and hospital operations teams. The identified pain points negatively impacted patient and clinician engagement, patient and family satisfaction, community perception of care delivery, and PG LTR (Press Ganey’s “Likelihood to Recommend”) scores.
In order to strategically alleviate these pain points, Northwell Health addressed this fundamental question with the goal of improving patient experiences: How can we measure and evaluate all of our patients’ experiences while they are within our care, and link their experiences to processes within our organization?
What process did you use to develop a solution?
Northwell Health as an organization understands the importance of patient experience and has set a goal to reach the 90th percentile in positive patient experience by 2019. Two primary drivers of a patient’s experience are the culture of the organization and the processes in which care is provided. In order to bridge the gap between culture and processes, a partnership between the Department of Patient and Customer Experience and Clinical Transformation was formed in 2015.
Northwell Health leveraged expertise from interdisciplinary team members, including front-line clinicians and operational leaders, to identify the most important factors contributing to the patient experience. Thus, the Patient Experience Bundle© (PEB©) was developed by integrating the expertise of the frontline staff with extensive data-driven modeling.
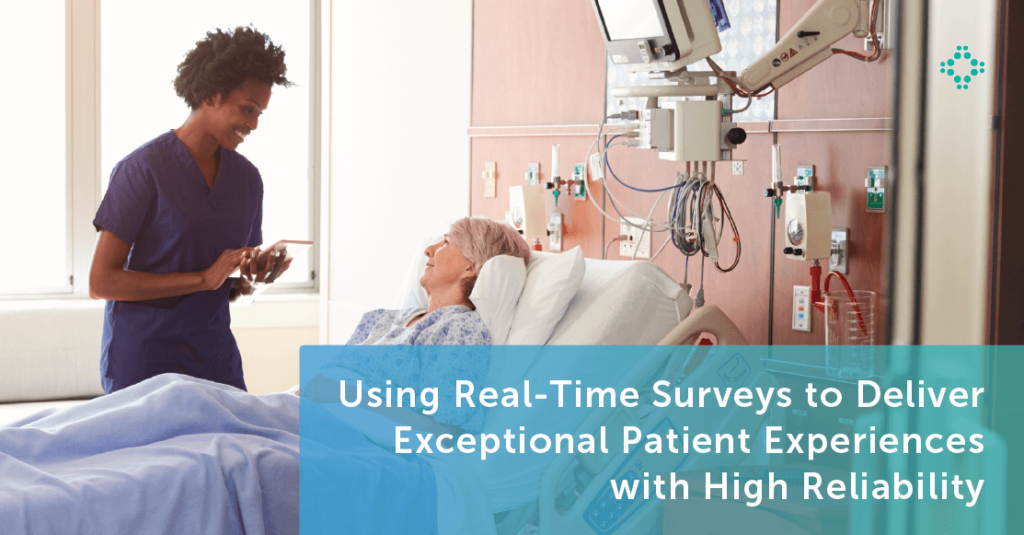
To enable the successful standardization of survey questions across the health system, Northwell’s Clinical Transformation team deployed the PEB© in partnership with an enterprise patient engagement platform. Northwell Health implemented the KLAS #1 Ranked Digital Rounding solution to measure and standardize the data-collection process with real-time flagging and feedback access – empowering providers to systematically address issues that would have otherwise been manually tracked.
What outcomes were you looking to achieve?
By identifying, quantifying, and addressing opportunities through real-time patient surveys, Northwell Health aimed to enhance the care experience for patients, families, and providers; increase brand loyalty; and prioritize areas for care delivery process improvement.
What specific steps did you take to address the problem?
Northwell Health developed and validated the PEB©, a weighted yield model that quantifies qualitative parameters in the hospital service delivery process and concurrently measures patient experience, using Six Sigma methodology and mathematical modeling.
To understand the critical components of the patient experience, Northwell’s Clinical Transformation team formed focus groups of clinicians and operational leaders from a broad cross-section of the organization in 2015. After collecting these insights and perspectives separately from multidisciplinary groups at different hospitals, the Clinical Transformation team identified common themes across settings to establish the four dimensions of the patient experience with a high correlation to outcomes: communication, environment, comfort/needs, and logistics.
After designing targeted questions to address each element of the patient experience, the PEB© was initially piloted at five hospitals in 2016. In reviewing the results of this pilot, the Clinical Transformation team found that similar process metrics impacted patient experience performance. As such, tertiary and community hospitals were added to the pilot, with statistically similar results.
After refining and validating the model with data from an additional five hospitals, the Clinical Transformation team developed and launched a “Quick Start” Program in 2017, designed for hospital units to yield patient experience improvements with a shorter lead time of four months. Designed and intended as a strategy for rapid uptake and improvement spread for the PEB©, the Quick Start Program enables more sites to successfully integrate and operationalize meaningful improvements into care delivery workflows in a shorter period of time. By standardizing patient survey questions and processes, the Quick Start Program establishes and scales a data-driven methodology for teams across the health system to identify specific opportunity areas within each of the four patient experience domains, implement targeted and sustainable solutions, and drive results in patient and clinician engagement. After deploying two rounds of the Quick Start Program with the digital rounding solution to standardize survey response collection, the survey questions and PEB© calculation are accessible for teams in a dashboard for real-time flagging and feedback access.
What resources, if any, did you engage – either internally or externally – to address the problem?
To quantify the patient experience through real-time patient surveys, Northwell Health incorporated the PEB© into the digital rounding solution to collect actionable data, send real-time service recovery alerts, and close the loop on opportunities identified. This digital rounding solution empowered front-line staff to capture and review patient feedback to systematically identify trends in opportunities identified and drive process improvement. By proactively engaging patients, this innovative rounding technology is changing the way that care is delivered at Northwell Health.
What measures did you establish to determine the success of this effort?
To determine the success of the PEB©, Northwell Health assessed real-time patient surveys and correlated results with PG LTR scores. The Clinical Transformation team established the PG LTR score as a measure of success because higher scores impact Hospital Compare ratings and translate to increased market share and reimbursement.
The first five tertiary EDs’ PEB© compliance score was 51% on average (ranging from 42% to 67%). After implementing process improvements around the issues identified by the PEB©, their PEB© scores improved to 82.5% on average (ranging from 78% to 93%). Those improvements also resulted in increasing the PG LTRs from 64.73% on average (ranging from 60.3% to 70.3%) to 74.64% on average (ranging from 62% to 76.9%). This data demonstrates that trends in improving PEB© compliance are followed by meaningful changes in PG LTR scores.
In the second stage, metrics for the two EDs and three inpatient units were used to validate the model. The baseline average PEB© compliance score for these hospitals was 62.5% (ranging from 55% to 80%). After implementing process improvements around the issues identified by the PEB©, PEB© scores improved to 80.6% on average (ranging from 70% to 95%). Similar to the first cohort of hospitals, their PG LTRs improved from 59.66% on average (ranging from 33.3% to 73.1%) to 69.5% on average (ranging from 66.3% to 77.5%). The data from this second cohort of sites not only validated the relation between the PEB© model and PG LTR scores, but also demonstrated that the model can be used in inpatient units as well as the ED.
The third stage focused on the sustainability of improvements. The PEB© compliance score for the ten initial sites was monitored as site teams adjusted their improvements and provided targeted service recovery as needed. Using the daily PEB© compliance score from the 2,758 patient surveys, the variation index, and standard deviation, the PEB© compliance score predicted the PG LTR score with 57.6% accuracy.
In the fourth stage, starting 2017, the Quick Start Program was used to spread the improvements involving four site teams. The baseline average PEB© compliance score for these hospitals was 60%, (ranging from 49% to 71%). After implementing improvements, their PEB© scores improved to an average of 82% (ranging from 58-96%). Similar to the initial ten sites, their PG LTRs improved from an average of 57.5% (ranging from 36.8% to 75%) to an average of 62.02% (ranging from 41% to 81.5%).
What was the ultimate outcome of your effort?
Daily PEB© compliance for 2,758 patient surveys in 18 different hospitals indicated 16.25% improvement on average (from 57.48% to 73.73%) with 5% reduction in variation (from 16.70% to 12.09%). Those improvements are positively correlated with a 13.91% increase in the PG LTRs from an average of 69.00% to 78.60%.
These improvements impact patients on a personal level. As an example of how teams are leveraging the rounding technology to proactively identify opportunity areas, the maternity unit team evaluated care delivery processes as new mothers frequently could not get enough rest with family members visiting around the clock. To improve the patient experience, the unit updated the visitor policy by adding quiet hours after 9 PM when only significant others can visit the mother and newborn.
What lessons did you learn you would share with others as they consider addressing a similar issue?
Patients view their healthcare not in disparate phases, but as a continuous process that is composed of a collection of encounters. As such, patient experience measurement processes should align with the whole patient experience, including an analysis and understanding of specific process factors and their correlations to drive enhanced patient engagement and satisfaction. To make sustainable improvements, healthcare organizations must make both cultural and process-driven changes that are quantifiable. By first looking to understand the levers of patient satisfaction, leaders can take targeted action to drive positive change.
About Northwell Health
Northwell Health is a dynamic organization of 23 hospitals and more than 650 physician practice locations spanning geographically from Westchester County to New York City and across Long Island. With 63,500+ employees, Northwell is the largest private employer in New York State, caring for more than 4 million individuals each year. Our mission is to improve the health and quality of the life for the people and communities we serve by providing world-class service and patient-centered care. Our brand is our promise to consumers, our Employee Promise is our promise to one another, and our Culture of C.A.R.E. is our promise to patients and families. The Culture of C.A.R.E. is at the heart of what we do and is grounded in the core elements of Connectedness, Awareness, Respect, and Empathy.
